Complete Smart Home Energy Audit Guide: Find and Fix Waste (2026)

A complete smart home energy audit identifies every inefficiency in your home and quantifies the financial return from fixing each one. This enables you to prioritize investments by payback period rather than guesswork, using actual consumption data from your smart devices rather than professional assessments costing $300-500 that take weeks to complete.
The one problem every audit reveals that surprises people isn’t phantom loads or dirty filters — it’s a single appliance consuming double what it should. In my experience running audits across two houses, the culprit is almost always the garage refrigerator. I spent two years troubleshooting a $45/month spike before I wired in an Emporia Vue 2 and watched a 22-year-old Kenmore pull 280 watts continuously. That single discovery paid back the entire monitoring investment in under three months. I’ll show you exactly how to find yours.
As an Amazon Associate I earn from qualifying purchases.
Why Every Home Needs an Energy Audit
The average US household wastes $200-400 annually on energy inefficiency — phantom loads running 24/7, HVAC systems working harder than necessary, and appliances consuming far more than their modern equivalents. Without an energy audit, you cannot identify which problems exist, which ones cost the most, or which fixes deliver the best return on investment. Most households spend $2,000-4,000 annually on electricity and natural gas, meaning 10-15% of that bill goes to waste that an audit could eliminate.
Smart home technology enables a level of audit precision that was impossible before affordable energy monitoring. Traditional audits rely on visual inspection and handheld meters to identify inefficiencies. Smart audits use continuous monitoring data to quantify exactly how much each device, circuit, and system consumes, revealing problems that momentary measurements cannot capture. A refrigerator that cycles twice as often as it should becomes obvious when monitoring reveals 40% more consumption than comparable models. On my Home Assistant dashboard, I plot every circuit as a 30-day bar chart — the outliers jump off the screen in a way that a walkthrough with a clipboard never matches.
The financial case for an energy audit is straightforward: the typical household saves $150-400 annually from audit-identified improvements, and the audit process itself costs nothing beyond equipment you may already own. Even if you hire a professional auditor at $400, the savings pay back the cost within 12-24 months, and the improvements continue delivering value for 10-20 years. I run a rolling audit on my own house every spring — the whole thing takes about 15 minutes a day across the four weeks, and I have caught two failing appliances before they died, saving both the replacement cost and the spike in wasted electricity.
Week 1: Baseline Energy Monitoring
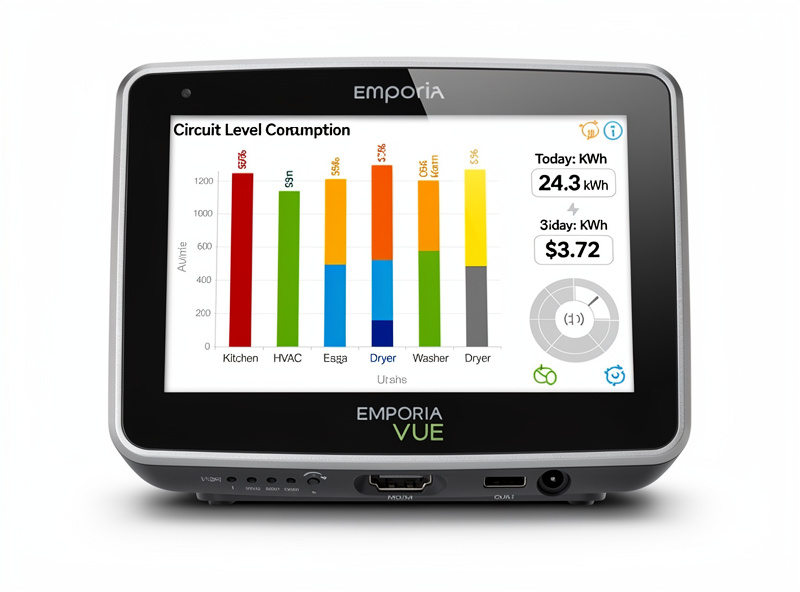
Begin by establishing your energy baseline using whole-home and circuit-level monitoring. If you already have an Emporia Vue or Sense monitor, review the past 30 days of data to understand your consumption patterns. If you do not have monitoring, install it before doing anything else — you cannot audit what you cannot measure. In my setup, the Emporia Vue 2 on every circuit feeds consumption data into Home Assistant via MQTT, and the difference between “we think we know what’s using power” and “we can see what’s using power” is night and day. The Emporia Vue 2 at $100 provides sufficient monitoring capability for a complete audit.
Document your baseline by recording daily consumption for seven consecutive days, noting weather conditions and any unusual activities. This baseline reveals your average daily consumption and shows how much variation exists between days. A household consuming 30-40kWh daily with minimal variation looks very different from one consuming 20-60kWh depending on whether someone’s home all day.
Identify your top 5 consumption circuits during the first week. In most homes, these are HVAC, water heating, kitchen outlets, garage, and laundry. These five circuits typically represent 60-70% of total consumption, making them your highest-priority optimization targets. If your HVAC circuit shows 15kWh daily but your home is only occupied 8 hours, that discrepancy indicates a problem worth investigating. I found my garage circuit pulling 4.2kWh on days nobody even opened the door — the culprit was a dehumidifier whose humidistat had failed, running 24/7 for what turned out to be months. That’s the kind of problem a baseline week catches.
Week 2: Appliance-Level Analysis
With circuit-level baselines established, investigate individual appliances using smart plugs with energy monitoring. Focus on the top 5 consumption areas your monitor identified. For each high-consumption appliance, plug it into a smart plug and measure its actual consumption over 48-72 hours under normal usage patterns. I keep a half-dozen energy-monitoring smart power strips specifically for audit rotations — labeling each one with the appliance and dates it covered so I can compare readings quarter to quarter.
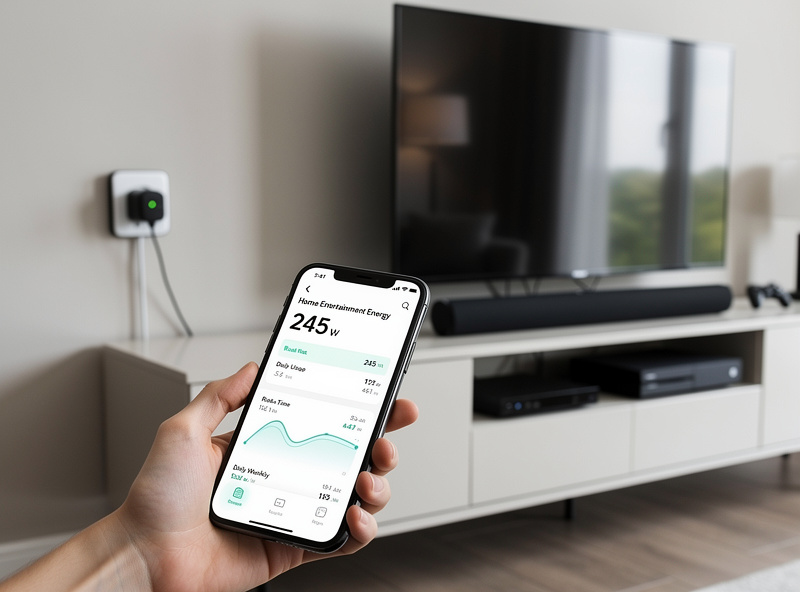
Common discoveries during appliance analysis include: refrigerators in garages or basements consuming 2-3x more than kitchen models due to temperature extremes, pool pumps running twice as long as necessary, space heaters left on continuously at 80°F, and entertainment centers consuming 150-200 watts even when “off.” Each of these problems has a specific fix with measurable ROI. When I ran this pass on my entertainment center, I found a 14-year-old receiver pulling 38 watts in standby — switching it to a smart-plug-controlled power strip that cuts power at midnight saved $42 a year for a $15 plug. Those are the satisfying wins.
For appliances you cannot plug into smart plugs, use the Kill A Watt EZ to measure consumption over a 24-hour period. This handheld meter records cumulative consumption that you compare against the device’s nameplate wattage. A device nameplated at 500 watts that actually consumes 600 watts is running 20% hot — a problem that will only worsen and may indicate impending failure. I learned this the expensive way with a chest freezer: the Kill A Watt showed 190 watts against a 120-watt nameplate, and I dismissed it as measurement error for a month. The compressor seized four weeks later, taking $300 worth of meat with it. Check any appliance pulling more than 25% above its nameplate wattage, and schedule maintenance or replacement if it persists across multiple readings.
Week 3: HVAC Deep Analysis
HVAC systems typically consume 40-50% of household energy, making them the highest-impact audit target. Beyond your thermostat’s programmed schedules, investigate actual runtime consumption. Ythe smart thermostat records daily runtime percentages — if it’s running 60% of the time in spring when outdoor temperatures are moderate, something is wrong with your system or your temperature settings. On my Ecobee, I pull the runtime reports monthly and compare them to the same month the prior year — a 10% jump with no weather change is the first warning that a capacitor is starting to sag or a coil is getting dirty.
Beyond runtime data, check the temperature delta between your supply and return air right at the air handler before moving to individual vents. A properly functioning system in cooling mode should show a 16-22°F temperature drop across the evaporator coil. If you are seeing 10°F or less, the system has a refrigerant charge problem, a dirty coil, or airflow restriction — all three degrade efficiency linearly: a system delivering only a 12°F delta instead of 18°F is working 33% harder to reach the same setpoint. I caught a slow refrigerant leak this way two summers ago — the delta drifted from 20°F to 14°F over three months before the system started short-cycling. The repair was a $250 recharge and a flare fitting; ignoring the drift would have been a $2,800 compressor replacement.
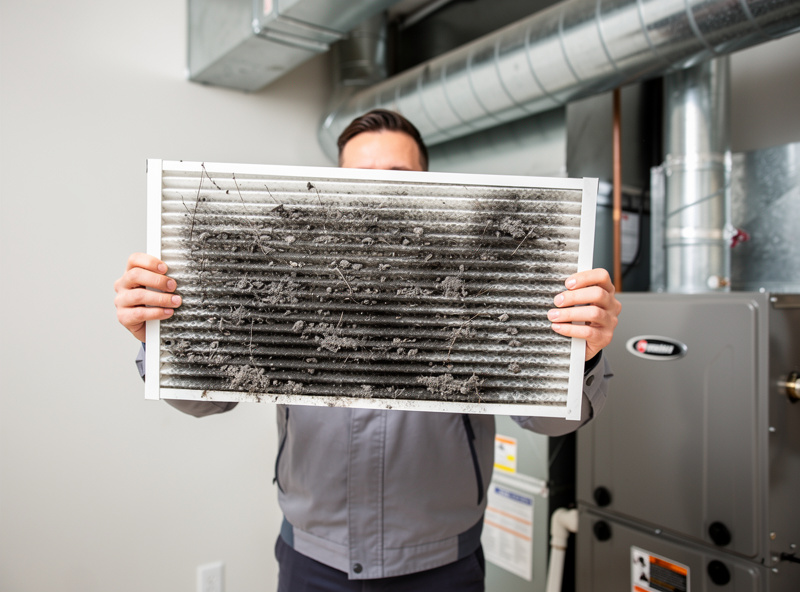
Check duct efficiency if you have access to return air and supply vents. Measure temperature differential between supply and return vents using a probe thermometer. A differential below 15°F for cooling or above 35°F for heating indicates duct problems — leaks, disconnections, or compression — that force your system to work harder while delivering less comfort. The moment I pushed a probe into my attic supply trunk and read 12°F delta when it should have been 18°F, I knew before crawling up there that I would find a disconnected boot. I did. The sound of a 6-inch flex duct flapping loose in an attic is unmistakable once you have heard it — a low, rhythmic whoosh that cycles with the blower and tells you conditioned air is hemorrhaging into a space nobody occupies. Professional duct sealing costs $300-600 but typically pays back within 2-3 years through reduced consumption.
Assess insulation levels in accessible areas like attics and rim joists. The Department of Energy recommends R-38 to R-60 for attics in most climates. If you can see exposed joists in your attic, you have less than R-19 — a problem that your HVAC system compensates for by working harder. Adding insulation to R-49 costs $1-2 per square foot and pays back within 3-5 years in reduced heating and cooling costs. My attic measured R-13 when I bought the house — the blower ran continuously on 90°F days. Twelve bags of blown-in cellulose and a borrowed machine later, the AC cycled normally and the upstairs bedrooms stopped cooking at 4 PM. The project took a Saturday, cost about $400 in materials, and the upstairs cooled off by 8°F on hot afternoons — measurable both in comfort and on the circuit-level monitor, where the HVAC compressor runtime dropped by 22% the following week.
Week 4: Data Analysis and Prioritization
After four weeks of data collection, analyze your findings to create a prioritized action list. For each identified problem, calculate its annual cost based on your utility rates and estimate the cost and payback period for the fix. Prioritize items with the shortest payback periods first, then work down the list as budget allows.
Example prioritization for a typical household: (1) Phantom load elimination by programming smart plugs to cut power to entertainment center and office equipment overnight ($15 cost, $120 annual savings, 2-month payback); (2) Smart thermostat setback scheduling ($0 cost if you already have one, $150 annual savings); (3) Refrigerator replacement if garage unit is 15+ years old ($800 cost, $200 annual savings, 4-year payback); (4) Duct sealing if differential indicates problems ($450 cost, $120 annual savings, 3.75-year payback); (5) Insulation upgrade if R-value is below recommendations ($1,200 cost, $180 annual savings, 6.7-year payback).
Document your findings and create a tracking system to verify savings after implementing fixes. Re-monitor consumption weekly during the first month after each change to confirm the savings materialize as expected. If a fix does not deliver expected savings, investigate whether the problem was more complex than initially assessed or whether additional issues exist. I track this in a simple spreadsheet fed by my Home Assistant energy dashboard — every fix gets a before/after consumption snapshot, and any that underperforms gets revisited before I move on to the next item on the list.
DIY vs Professional Energy Audit: Which Should You Choose?
| Factor | DIY Smart Home Audit | Professional Audit |
|---|---|---|
| Cost | $100-200 (equipment you keep) | $300-500 (one-time) |
| Duration | 4 weeks of continuous monitoring | 2-3 hours of spot measurements |
| Data detail | Circuit-level and appliance-level, 24/7 | Whole-home blower door, thermal imaging |
| Detects intermittent problems | Yes — captures every day for a month | No — only what is measurable during the visit |
| Identifies phantom loads | Yes — smart plugs measure standby draw | Rarely — auditors check major loads, not idle draw |
| Finds duct leaks | Temperature differential method (crude) | Blower door + duct blaster (precise) |
| Best for | Ongoing optimization, renters, budget-conscious homeowners | Pre-purchase inspection, major renovation planning, utility rebate qualification |
The approach I recommend: do the DIY audit first. The four weeks of continuous data will give you a list of problems with actual dollar figures attached. If that list includes major envelope issues — high blower-door-equivalent leakage, significant duct loss — then hire a professional for those specific measurements. The DIY audit saves you $300-500 on the inspection itself and ensures the professional’s time is spent on problems you already know exist. For renters or apartment dwellers who cannot install circuit-level monitors, smart plugs alone can capture 60-70% of the same data by instrumenting every outlet-fed appliance for a month. Even with that limitation, you will find the phantom loads and inefficient appliances that drive 50% of most households’ waste — and every dollar saved in an apartment is a dollar you keep twice, since you do not benefit from efficiency improvements that raise property value.
Ongoing Energy Monitoring and Maintenance
An energy audit is not a one-time event but the beginning of continuous optimization. After addressing identified problems, maintain the monitoring infrastructure to track consumption trends over time. Set budget alerts at $5-10 increments above your target to receive notifications when costs drift upward, indicating new inefficiencies or equipment degradation. My Home Assistant sends a push notification if daily total consumption exceeds the 30-day rolling average by more than 15% — that single automation has caught a stuck well pump contactor and a failing freezer compressor before either became an emergency. For the well pump specifically, the contactor welded closed and the pump ran continuously for 18 hours — the energy spike notification hit my phone at 4 AM, and shutting the breaker saved $14 in electricity and a $600 pump replacement. Without the alert, I would have noticed when the water stopped working two days later.
Establish quarterly reviews to compare consumption against previous quarters, adjusting for weather variations using heating and cooling degree days. A 10% increase in consumption compared to the same quarter last year, adjusted for weather, indicates new problems worth investigating. Equipment that worked fine last year may have degraded, or new behaviors may have introduced unexpected consumption.
Schedule annual HVAC maintenance including filter replacement, duct inspection, and refrigerant level checks. A well-maintained HVAC system operates 10-15% more efficiently than a neglected one. Clean filters alone can reduce HVAC energy consumption by 5-15% by maintaining proper airflow. This 30-minute maintenance task costs nothing but delivers immediate savings. Write it into the calendar as a recurring spring and fall event, and pair it with a 30-second glance at your energy dashboard to confirm nothing has drifted since last quarter.
If I were starting from scratch tomorrow, I would do three things before touching a single smart plug: install a circuit-level monitor on every breaker, set up a weekly consumption email from the utility, and walk every room with a Kill A Watt for one weekend. That weekend catches 80% of the waste. The remaining 20% is the long tail — slowly degrading compressors, creeping standby loads on new devices, seasonal HVAC drift — and that is what the quarterly reviews catch. An energy audit is not a project you finish. It is a habit you build into the house’s calendar, just like changing the furnace filter. Get the data flowing once, and the house tells you when something is wrong. That is what a smart home energy management system actually earns you — not a dashboard you ignore, but a warning system you trust.
The most valuable number from any energy audit is not the total dollar figure — it is the payback period per fix, ranked shortest to longest. Fix the two-month payback items this weekend. Budget the two-year items into next year’s maintenance. And for the long-tail monitoring, let the automations do the watching. The house will tell you when something drifts. All you have to do is listen. Four weekends, a few hundred dollars in monitoring gear, and a spreadsheet is all it takes to stop paying for electricity you never used.
Frequently Asked Questions
How much does a smart home energy audit cost?
A smart home energy audit costs $0-200 depending on equipment you already own. If you have smart plugs and a circuit-level monitor, the audit costs nothing. If you need to purchase monitoring equipment, an Emporia Vue 2 ($100) and a Kill A Watt EZ ($25) provide sufficient capability for a complete audit. Professional audits cost $300-500 but may qualify for utility rebates.
How long does an energy audit take?
A complete smart home energy audit takes 4 weeks: 1 week for baseline monitoring, 1 week for appliance-level analysis, 1 week for HVAC deep analysis, and 1 week for data analysis and prioritization. You spend 15-30 minutes daily collecting data and 2-3 hours at the end for analysis. This is significantly less time than a professional audit but delivers comparable results.
What equipment do I need for a DIY energy audit?
A circuit-level energy monitor like the Emporia Vue 2 ($100) provides whole-home and circuit-level consumption data. Smart plugs with energy monitoring ($15-25 each) measure individual appliances. A Kill A Watt EZ ($25) measures devices you cannot plug into smart plugs. A probe thermometer ($20) measures duct efficiency. Total equipment cost: $100-200 for a complete audit capability.
How much can an energy audit save?
A smart home energy audit typically saves $150-400 annually from identified and fixed inefficiencies. The exact savings depend on how many problems exist and how severe they are. Households with older appliances, poor insulation, and neglected HVAC maintenance often save $400-600. Even households already maintaining their homes typically find $100-200 in savings from phantom loads, scheduling optimizations, and behavioral improvements.
Should I hire a professional or do a DIY audit?
Do a DIY audit first using smart home monitoring equipment. The data you collect identifies problems more precisely than a visual inspection. If your audit reveals problems you cannot fix yourself — duct sealing, insulation upgrades, HVAC repairs — hire a professional for those specific tasks. A DIY audit saves $300-500 and often identifies problems that a professional audit misses because you monitor continuously rather than inspecting momentarily.
What is the biggest energy waste found in most homes?
Phantom loads from entertainment centers and office equipment typically cost $150-250 annually when left running 24/7. HVAC inefficiencies from dirty filters, leaky ducts, and improper setbacks cost $100-300 annually. Old refrigerators in garages consuming 2-3x more than modern ENERGY STAR models cost $30-80 monthly. These three categories alone often exceed $400 in annual waste.
Related Articles
- Best Smart Home Energy Management Systems 2026: Complete Guide
- Best Smart Electricity Monitors for Home
- How to Reduce Your Electric Bill with Smart Home Devices
- How Much Does a Smart Thermostat Save? Real Data
- How to Set Up a Smart Home Energy Dashboard
- Whole-Home Energy Monitor vs Smart Plugs