Smart Appliance Energy Monitoring: Watts to Automations
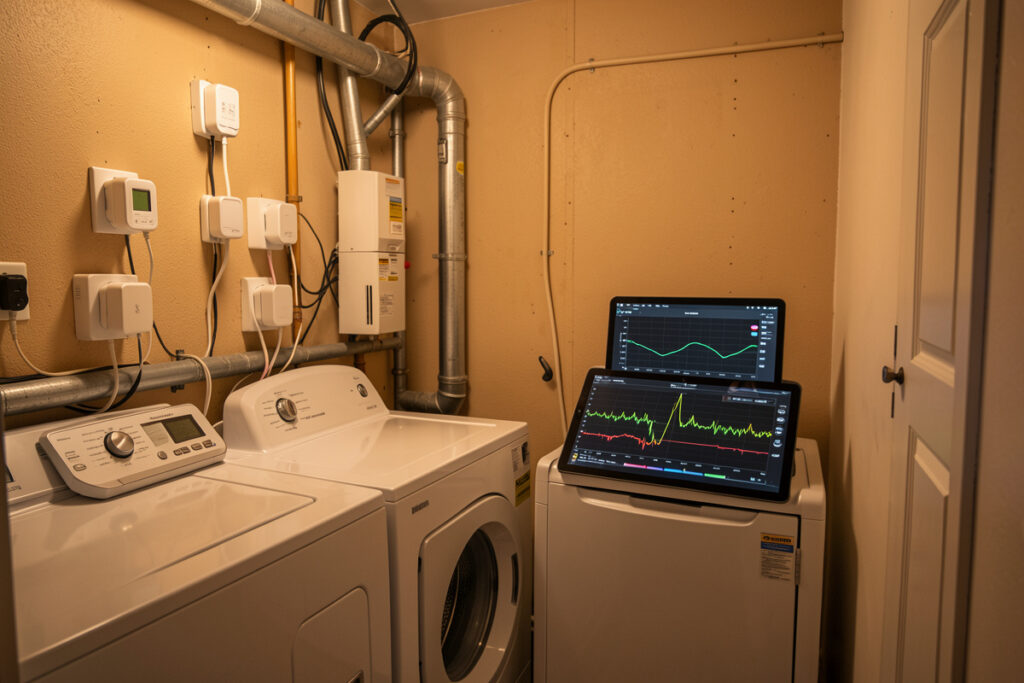
Smart appliance energy monitoring is the foundation the rest of appliance automation is built on: once your hub can see an appliance’s power curve, it can tell running from idle from finished without any cooperation from the appliance itself. In my setup a $15 energy-reporting plug turns a dumb dishwasher into a sensor — under 2 W idle, 1,300 W on the heating element — and that single live number triggers every notification, off-peak schedule, and safety alarm downstream.
I run a local-first Home Assistant install, and energy monitoring was the change that made my appliances legible instead of mysterious. Before it, “is the wash done?” meant walking to the utility room. After it, the hub knew, and could decide whether to tell me. This guide covers the three ways to monitor appliance energy, how to read the curves, the thresholds that turn watts into states, and how to keep the data flowing reliably and locally.
Three ways to monitor appliance energy
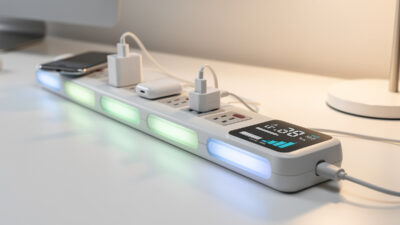
You have three real options, and they are not mutually exclusive: per-appliance energy plugs, panel-level CT clamps on individual circuits, and a whole-home monitor at the main feed. Plugs are cheapest and most granular for individual appliances; CT clamps live at the breaker and are the only safe choice for hardwired high-draw loads like an oven; a whole-home monitor gives you the total picture but cannot tell two appliances apart on the same circuit.
For appliance automation specifically, per-plug monitoring is where most people should start, because the data maps one-to-one to an appliance and the thresholds are easy to set. I use clamps only where there is no plug to use — the oven and the dryer’s dedicated circuit. The full plug-versus-panel decision is in whole-home energy monitor vs smart plugs, and the circuit-level approach I run is documented in my CT-clamp energy dashboard over MQTT. This all sits under the broader smart home appliance automation framework.
| Method | Best for | Granularity | Cost | Switching? |
|---|---|---|---|---|
| Energy plug | Plug-in appliances | Per-appliance | ~$15 each | Yes (where safe) |
| Panel CT clamp | Hardwired / high-draw circuits | Per-circuit | $$ per channel | No — monitor only |
| Whole-home monitor | Total household picture | Whole-house | $$$ once | No |
Reading the power curve: running, idle, finished
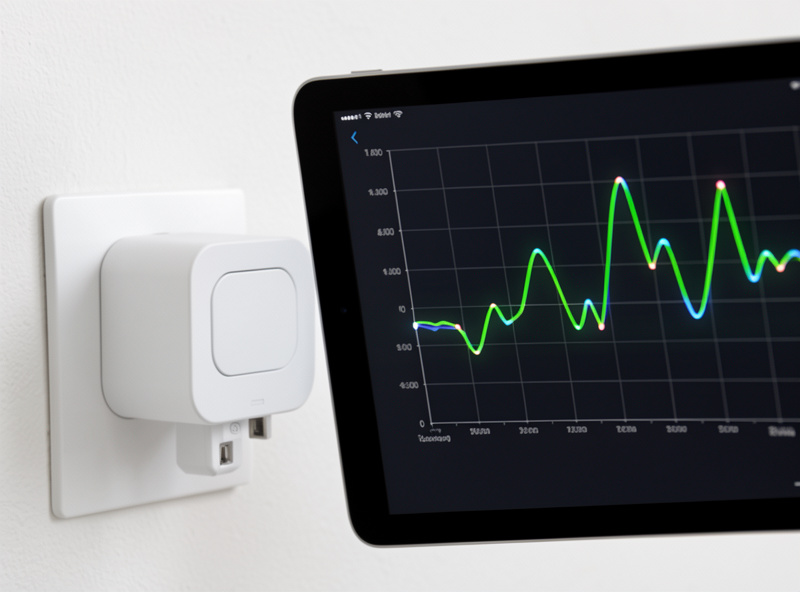
Every appliance has a power signature, and learning to read it is the whole skill. A dishwasher climbs to 1,200-1,500 W when the element fires, drops near zero during soak, and settles under 2 W when done. A washer peaks around 2,000 W on the heater and idles at 1-3 W. A dryer holds 2,000-3,000 W for most of the cycle. Once you watch a couple of cycles on a graph, the stages become obvious and you can pick thresholds with confidence.
The translation from watts to state rests on two numbers per appliance: a running threshold and a finished-debounce. Running means power above the threshold; finished means power stayed under the off threshold for a set time. The debounce is the part people skip and regret, because appliances pause mid-cycle and a naive zero-power rule fires false “done” alerts. My first dishwasher automation buzzed me “finished” three times in one wash before I added a three-minute under-threshold debounce and the false alerts stopped. I cover the appliance-specific numbers in smart washer dryer automation and dishwasher smart plug automation; the principle is identical across all of them.
Turning watts into a state sensor
In Home Assistant I build a template binary sensor for each appliance — kitchen_dishwasher_running, laundry_washer_running — that reads the plug’s power entity and applies the threshold and debounce. The naming follows one scheme, area_device_measurement, so a new appliance is a copy-paste plus a couple of renames rather than an archaeology dig through cryptic entity IDs. Consistency here is what keeps a dozen appliance entities maintainable.
That binary sensor is what every downstream automation actually listens to — the notification, the off-peak nudge, the safety alarm. It is far more reliable than trying to read a connected appliance’s cloud state, because it depends only on a local power reading and a bit of math, both of which work during an internet outage. For DIY nodes where no commercial plug fits, I build energy reporting with ESPHome — see ESP32 and ESPHome DIY sensors.
What energy monitoring actually saves you
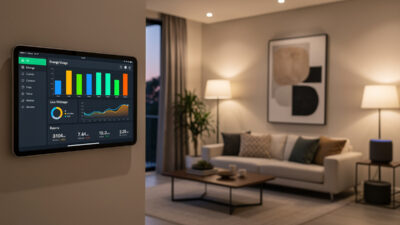
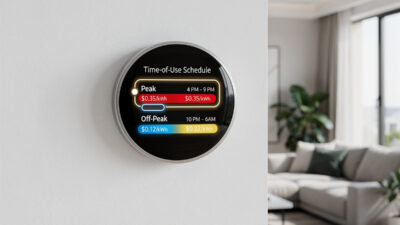
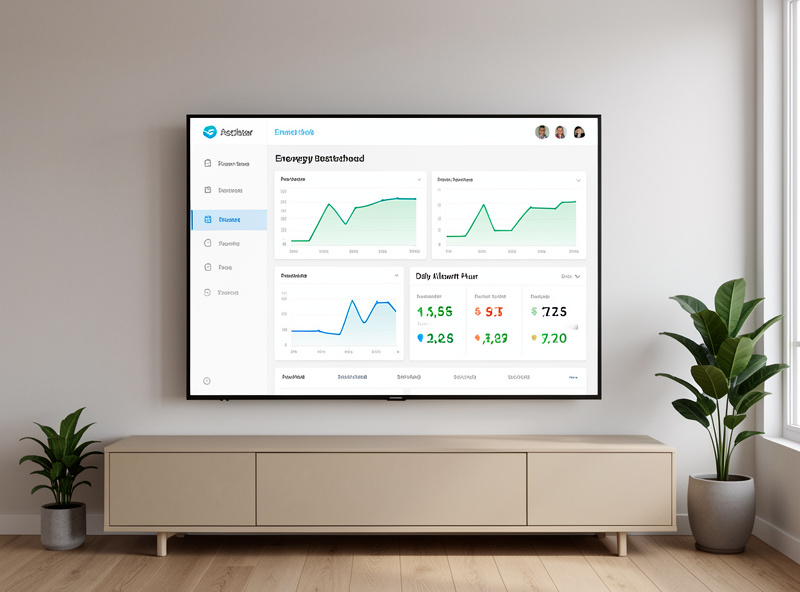
Beyond automation triggers, per-appliance energy data answers questions you could never answer before: which appliance is quietly eating your bill, whether the old fridge is worth replacing, and how much a time-of-use tariff shift would actually save. Seeing a dryer’s daily kilowatt-hours in black and white is what convinces a household to start running it off-peak. The data turns vague “we should use less” guilt into specific, actionable numbers.
It also catches faults. A fridge compressor that starts running far more than usual, a kettle drawing oddly, a dryer cycle that runs longer each month as the lint trap clogs — all show up as drift in the energy data before they become failures. I keep a simple dashboard per appliance and glance at it weekly. The whole-house version of this is in my complete smart home energy audit guide and the best smart home energy management systems.
Keeping the data reliable and local
Monitoring is only useful if the data keeps flowing, so radio choice matters. I run energy plugs on Zigbee where I want fast, frequent power reporting — appliance state detection needs a sample every few seconds, not every few minutes — and Z-Wave for the longer, wall-buried runs. Wi-Fi plugs report fine until the 2.4 GHz band gets crowded, and the kitchen and laundry are exactly where it gets crowded. Mesh radios relay through other mains-powered nodes and stay reliable in those RF-hostile rooms.
Keep the Zigbee coordinator away from USB-3 ports and microwaves, or the plugs nearest the appliances drop out — the gotcha is in Zigbee range and interference problems. The radio comparison is in Zigbee vs Z-Wave vs Wi-Fi, and I keep all the monitoring devices on a segmented IoT network per the smart home VLAN guide so a flood of chatty meters never destabilizes the main LAN. Get the data local and reliable, and energy monitoring becomes the quiet backbone the whole appliance layer stands on.
As an Amazon Associate I earn from qualifying purchases. The cheapest way in is an energy-monitoring Zigbee plug; for hardwired circuits step up to a CT-clamp energy monitor.
Frequently Asked Questions
What is the best way to monitor a single appliance’s energy use?
An energy-reporting smart plug. It maps one-to-one to the appliance, costs about $15, and gives per-second power data the hub can turn into running, idle and finished states. For hardwired high-draw appliances, use a panel CT clamp instead.
Can energy monitoring tell when an appliance cycle is finished?
Yes. Set a running threshold and a finished-debounce. The appliance is running above the threshold and finished only after power stays under the off threshold for a set time, usually two to three minutes, which prevents false alerts during mid-cycle pauses.
Do I need a whole-home energy monitor or just plugs?
For appliance automation, start with plugs because the data maps directly to each appliance. A whole-home monitor shows the total picture but cannot separate two appliances on the same circuit. Many setups use both, with clamps for hardwired loads.
Why use Zigbee instead of Wi-Fi for energy plugs?
Appliance state detection needs frequent samples, and laundry rooms and kitchens are RF-crowded. Zigbee plugs mesh through other mains-powered nodes and report reliably, while Wi-Fi plugs hold their own connection and drop first when the 2.4 GHz band is busy.
Will energy monitoring help lower my bill?
It turns guesswork into numbers. Per-appliance data shows which device eats the most power, whether an old fridge is worth replacing, and how much an off-peak schedule would save, so you can act on specifics instead of vague intentions.
Can energy monitoring detect appliance faults?
Often, as drift before failure. A fridge compressor running more than usual, a dryer cycle lengthening as the lint trap clogs, or odd draw on a kettle all show up in the energy data early. A weekly glance at per-appliance graphs catches them.
Further Reading
- Smart Home Appliance Automation (hub)
- Whole-Home Energy Monitor vs Smart Plugs
- CT-Clamp Energy Dashboard over MQTT
- Complete Smart Home Energy Audit Guide
- Smart Washer & Dryer Automation